Reporting on log data
The Reports module lets you create reports based on MFT Server user activity.
To access the Reports module, navigate to [Domain] > AUDIT > Reports. The reports grid displays.
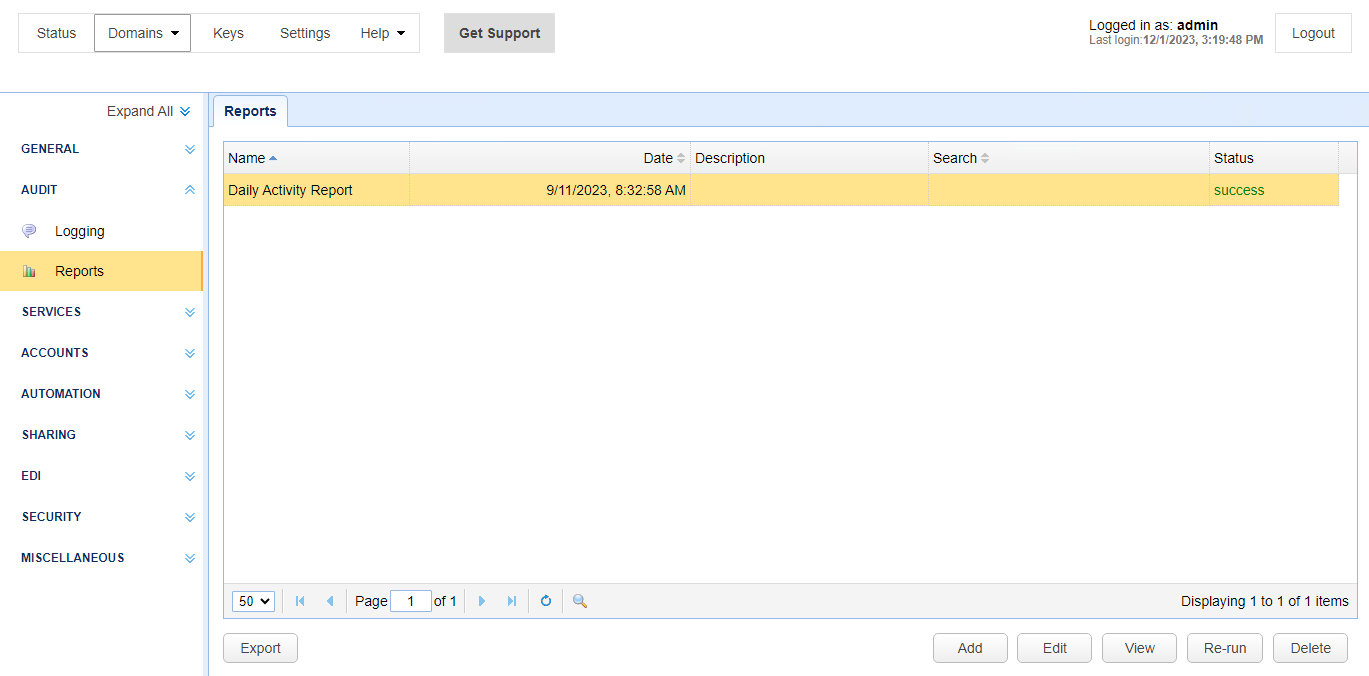
The Reports grid includes the following columns:
Name — Identifies the name of the report.
Date — Identifies the date and time the report was created.
Description — Identifies a description of the report.
Search — Identifies the search used when the report is generated — see Search log data
Note: Adding a search is optional. A search lets you filter report data. For example, you can create a report to list the total bytes uploaded, then add a search where the report only applies to a specific user.
Status — Displays the percentage of the report processed.
The Reports module includes the following buttons:
Export — Exports report data to a JSON file.
When selected, the user is prompted to enter a Filename.
The JSON file is placed in the user's Download folder by default.
Add — Add a new report.
Edit — Edit an existing report.
All fields except
Namecan be modified.
View — View the selected report
The report results are displayed in a new browser tab
Note: The View button is enabled when theStatuscolumn displayssuccess. If theStatuscolumn displays a % value (the percentage of report processing complete), click the refresh icon to update the status.Re-run — Re-run the selected report using the latest data from the log file
Note: After selecting Re-run, click the refresh icon to update the status column. The system does not auto-refresh the grid after a Re-run is initiated.Delete — Delete the selected report.
Note: When viewing or exporting data, there is no limit to the data displayed in the view or added to the export file.
The Reports module includes the following icons:
Refresh icon — Refreshes the report list and updates the Status column.
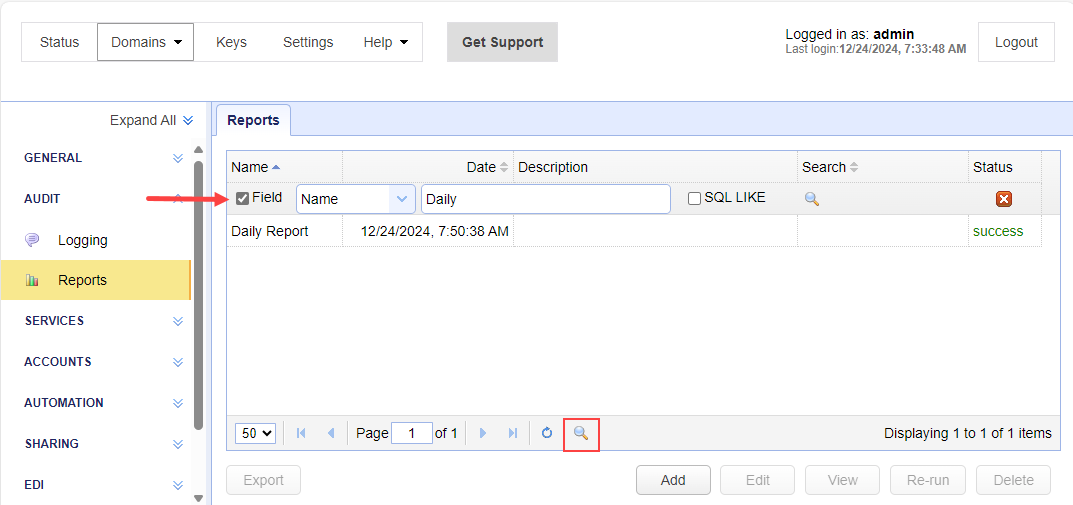
Search icon — This lets you search for a specific report (see the image below).
Adding a Report
Click
Add.
The
Add Reportdialog displays.
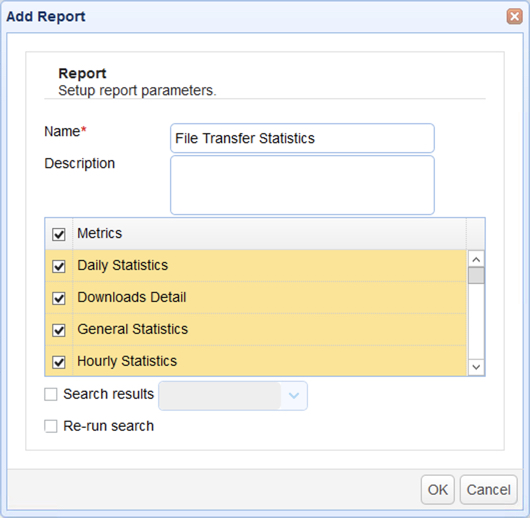
Add Report fields:
Name — Identifies the unique report name.
Description — Identifies the report description.
Metrics — Identifies metrics to include in the report. Select one or more desired metrics. Metrics include:
Daily Statistics
Downloads Detail
General Statistics
Hourly Statistics
Last User Logon
Monthly Statistics
Top Attachments Received
Top Attachments Sent
Top Downloads
Top Errors
Top External Downloads
Top External Uploads
Top Hosts
Top Uploads
Top Users
Total Bytes Downloaded
Total Bytes Uploaded
Total Downloads
Total External Bytes Downloaded
Total External Bytes Uploads
Total External Downloads
Total External Uploads
Total File Attachment Bytes Received
Total File Attachment Bytes Sent
Total File Attachments Received
Total File Attachments Sent
Total Sessions
Total Unique lps
Total Uploads
Uploads Detail
User Detail
Total File Attachment Received
Search results — When selected, this identifies the search result to use when the report runs. The Search results dropdown list is populated using searches listed in [Domain] >
AUDIT > Logging > Results— see Search log data.
Re-run search — When selected, the search results chosen in the above-described
Search resultsdropdown list will be re-run (using the latest logging data) when the report is run.
Click
OK. The system generates the report. Upon successful completion, the Status column displayssuccess. You can view or export the report as you would like.
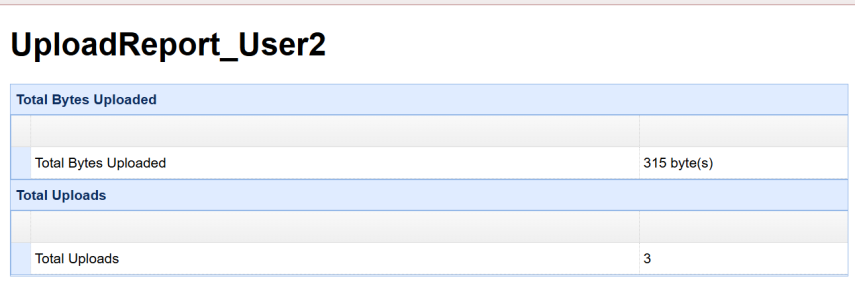
Assume you would like to run a report that includes the Total Bytes Uploaded and Total Uploads metrics — for a specific user. The user has already been created in [Domain] > Accounts > Users.
-
Navigate to [Domain] >
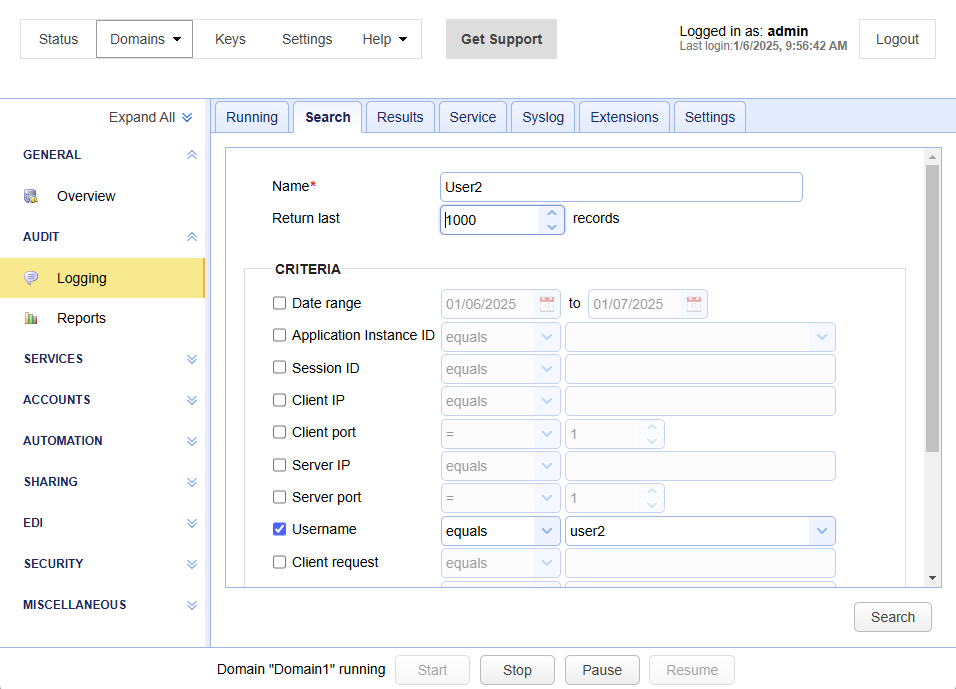
AUDIT > Logging > Search. The Search tab displaysaddfields by default (you can only add searches using this module). -
Name — Enter the search name.
-
Under the CRITERIA heading, select Username, then select
equals, then select the desired user from the dropdown list. See the image below.
-
Click Search.
-
The [Domain] >
AUDIT > Logging > Resultstab displays, with the new search selected. This search result will be added to the report, which will be described next. -
Navigate to [Domain] >
AUDIT > Reports. ClickAdd. -
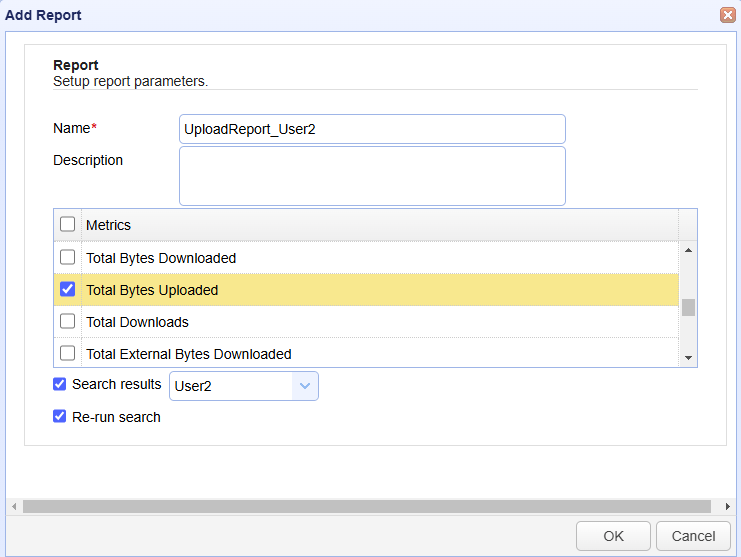
The
Add Reportdialog displays. See the image below. -
Name — Enter a report name.
-
Description - Enter a report description.
-
Deselect Metrics (the topmost checkbox), which is selected by default. This deselects all the metric options.
-
Select the
Total Bytes UploadedandTotal Uploadsmetrics.
-
Search results — Select the search results (created in the earlier step) from the dropdown list.
-
Click
OK. The report generates.
-
Click the refresh icon to update the Reports grid.
-
Select the report. When the Status column displays
success, click View. The report displays in a new browser tab. See the example report below.