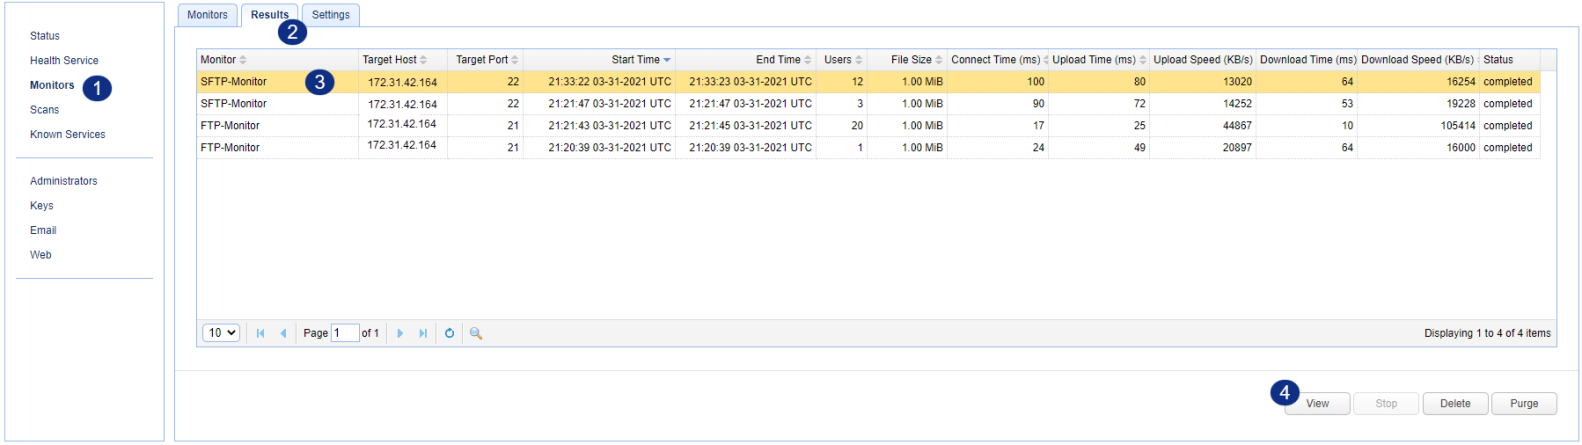
Viewing monitor results
To view the session results for a monitor, navigate to the Monitors > Results page in MFT Monitor. To view the results of a session, select desired session and click the View button.
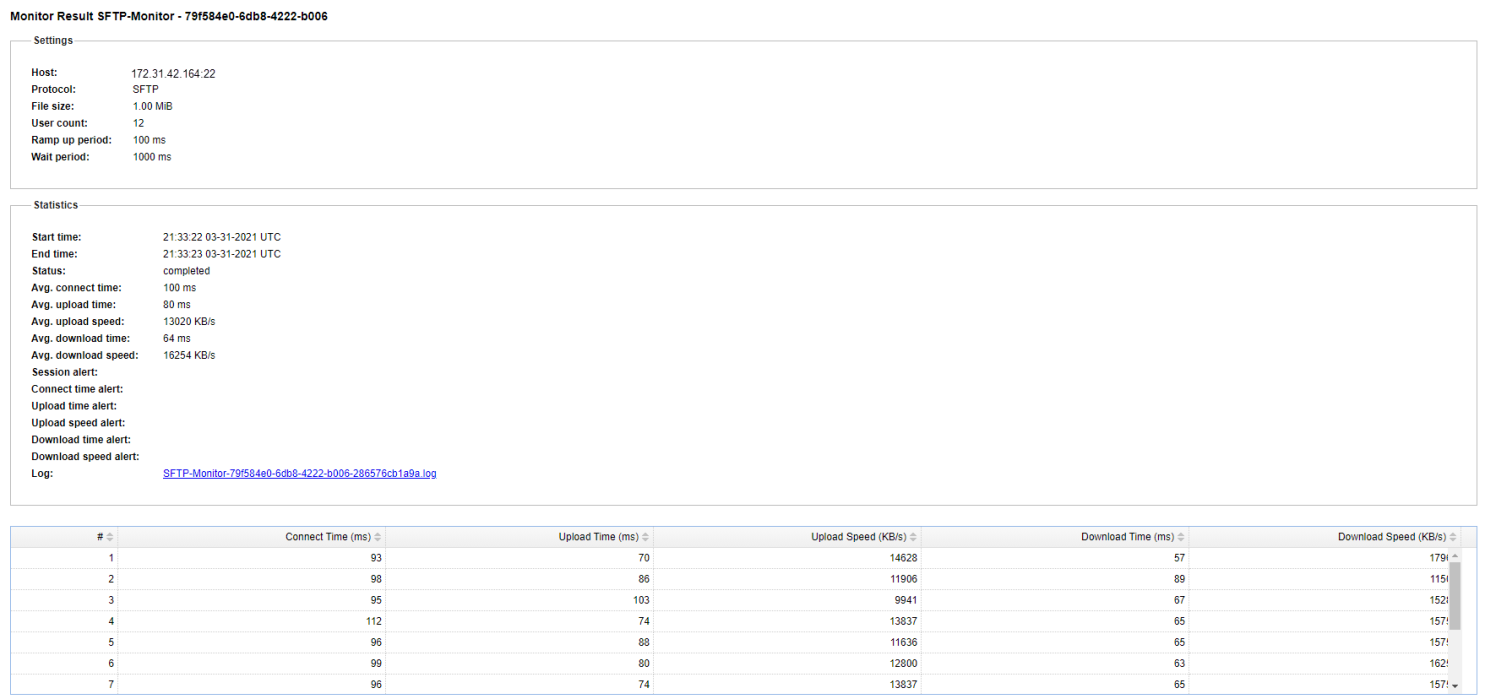
Summary
This panel displays a high-level summary of the session including load settings and average connect, throughput, upload and download times.
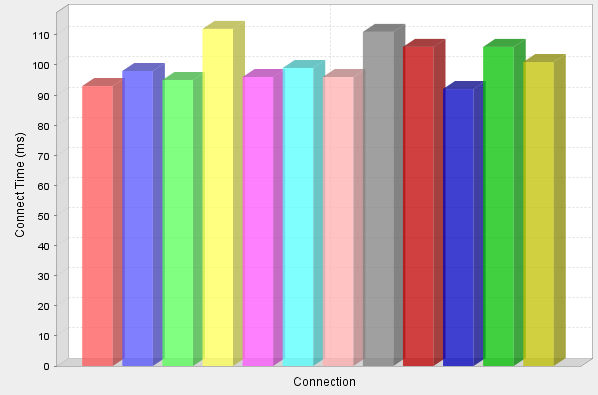
Connect Time
This panel includes a graph of the connection time for each user session.
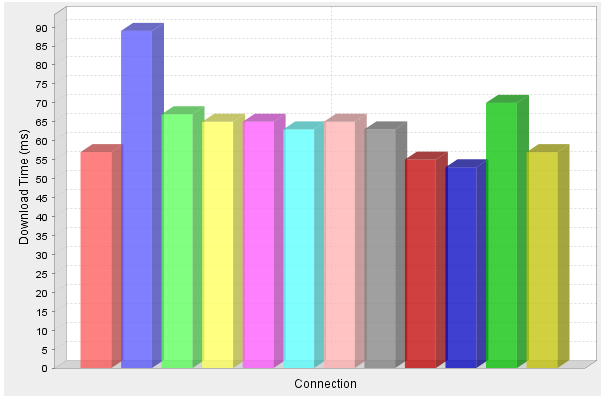
Download Time
This panel includes a graph of the download time for each user session.
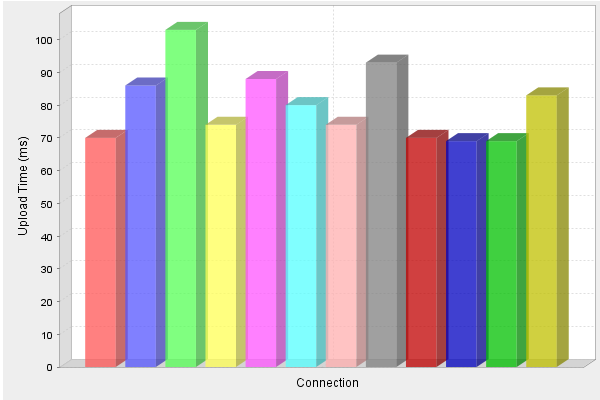
Upload Time
This panel includes a graph of the upload time for each user session.
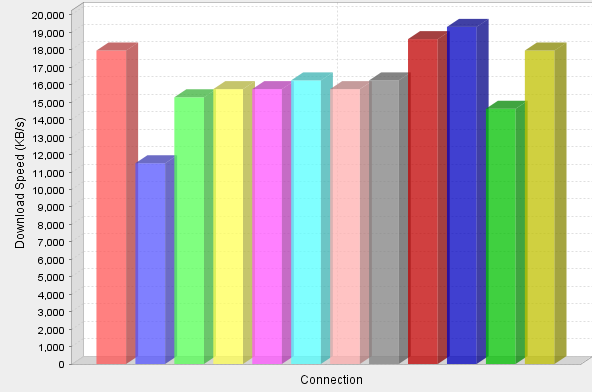
Download Speed
This panel includes a graph of the download speed (KB/s) for each user session.
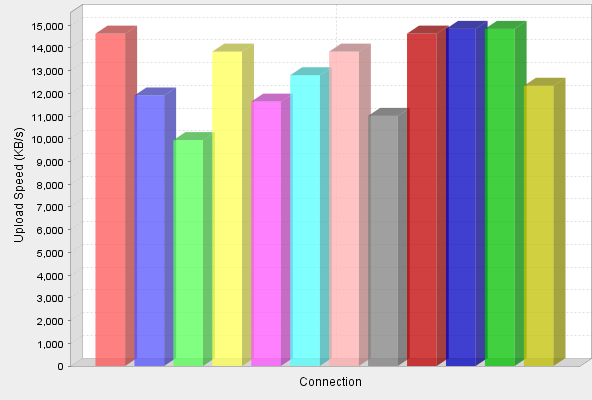
Upload Speed
This panel includes a graph of the upload speed (KB/s) for each user session.
Connections
This panel shows the connect, upload and download times in ms (milliseconds) for each user session.