Logs
The Settings > MANAGER SERVICE > Logs module displays administrative logs in the Records grid, and allows you to optionally log the same data to a Syslog service or Extension. The Extension supported at this time is the Splunk HTTP Event Collector. The Logs module also lets you set Debug options when troubleshooting an MFT Server issue.
User log data, navigate to [Domain] > AUDIT > Logging.
Administrative logs are used to track all administrative log ins and changes to configuration data, as depicted in the image below.
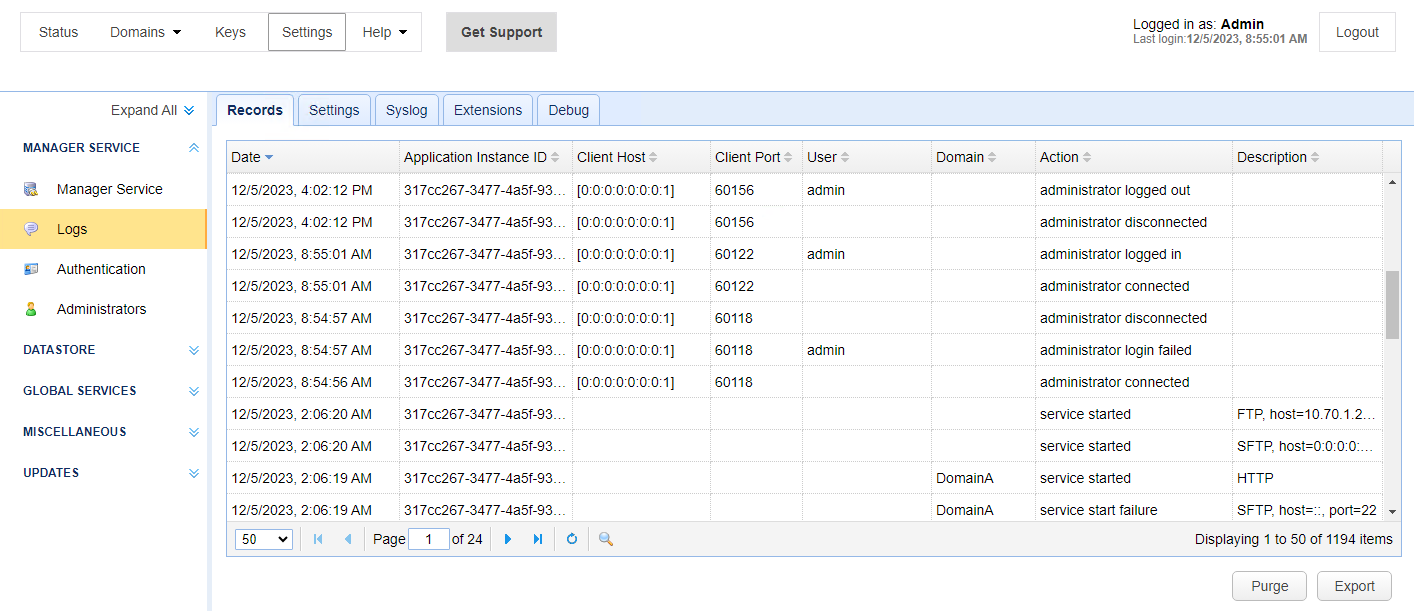
Records
Date — Identifies the date and time the action occurred.
Application Instance ID — Identifies the application instance ID that handled the request. This ID uniquely identifies the MFT Server instance, which helps distinguish between nodes in a multi-node high availability (HA) cluster. If the MFT Server instance is not part of an HA cluster, then this value will always be the same.
Client Host — Identifies the client IP address of the administrator.
Client Port — Identifies the client port of the administrator.
User — Identifies the log in of the administrator.
Domain — Identifies the domain affected by this change.
Action — Identifies the action that occurred.
Description — Identifies a description of the action that occurred.
Purge — Performs a purge of all administrative records.
Export — Exports all administrative records to a CSV file.
Settings
Clear records older than N days — If selected, log records older than N days are purged from the database.
Syslog
This option sends administrative logs to a Syslog service. When selected, activity is logged to a Syslog daemon in addition to the MFT Server log file.
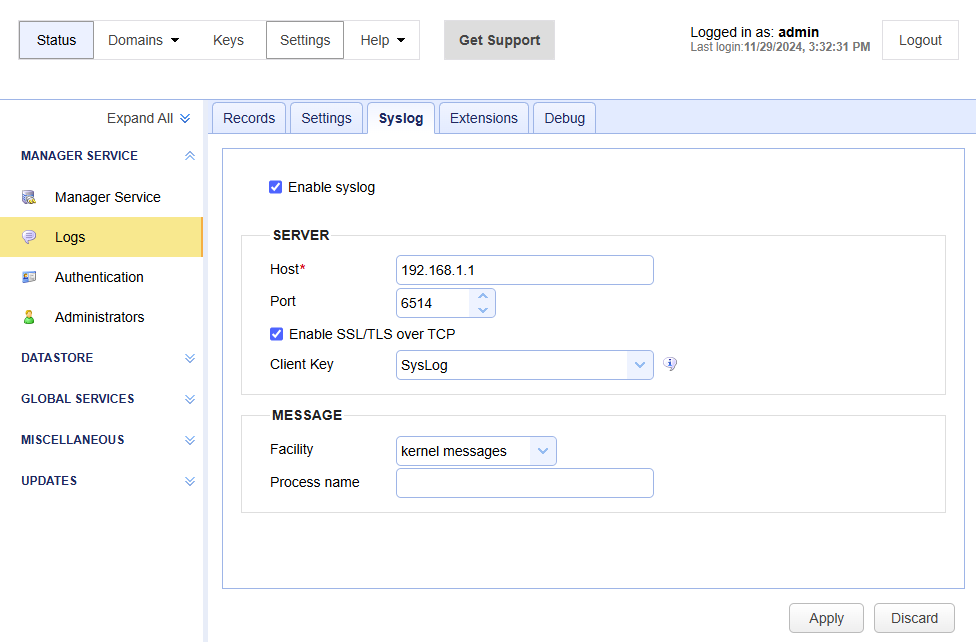
Enable Syslog — If selected, administrative logs are sent to a Syslog service.
SERVER
Host — Identifies the IP address of Syslog daemon.
Port — Identifies the port of Syslog daemon. When Enable SSL/TLS over TCP is selected, the default port is 6514. When Enable SSL/TLS over TCP is not selected, the default port is 514.
Enable SSL/TLS over TCP — When selected, the data is transferred using SSL/TLS over TCP.
Configure and click Add TLS Interface. Keep the default port of 6514. You have the option to generate a self-signed certificate using Syslog Watcher Manager. Alternatively, you can obtain a certificate from a Certificate Authority (CA). It depends on your specific needs and security requirements.
Client Key — Identifies the Syslog server certificate. Import the previously created certificate by selecting Keys > Client Keys > Import > Import File, enter a Key alias name and then enter the certificate file name.
MESSAGE
Facility — Identifies the Syslog facility to use.
Process name — Identifies the Syslog process name.
Extensions
Log to Splunk HTTP Event Collector—When checked, MFT Server sends administrative logging data to a Splunk HTTP Event Collector (HEC). You must have a Splunk HEC installation to use this option. This feature works in addition to existing administrative logging and the Syslog service if enabled (Settings > MANAGER SERVICE > Logs > Syslog).
Host — Identifies the IP or hostname of the Splunk Enterprise or Splunk Cloud Platform server.
Port — Identifies the port of the Splunk deployment. The default is 8088.
Timeout — Identifies the connection timeout in seconds. The default is 30.
Access token — Identifies the token used by the MFT Server to authenticate the connection to Splunk HEC. Your Splunk administrator or a designated token administrator should generate and provide you with a valid token.
Source—Identifies the source value to assign to the event data. This typically identifies the application from which the data is coming (e.g., MFT Server).
Source Type — Identifies the source type value to assign to the event data. This typically identifies the type of data coming from the source. (e.g., Administrative logs).
Use SSL Connection — If selected, an SSL connection is used to connect to the Splunk deployment.
Index — Identifies the name of the Splunk index.
Test Parameters — Click to test the connection from the MFT Server to the Splunk deployment.
Log Extension Failure
This tab allows you to enable MFT Server debugging and view the debug output in the server log file.
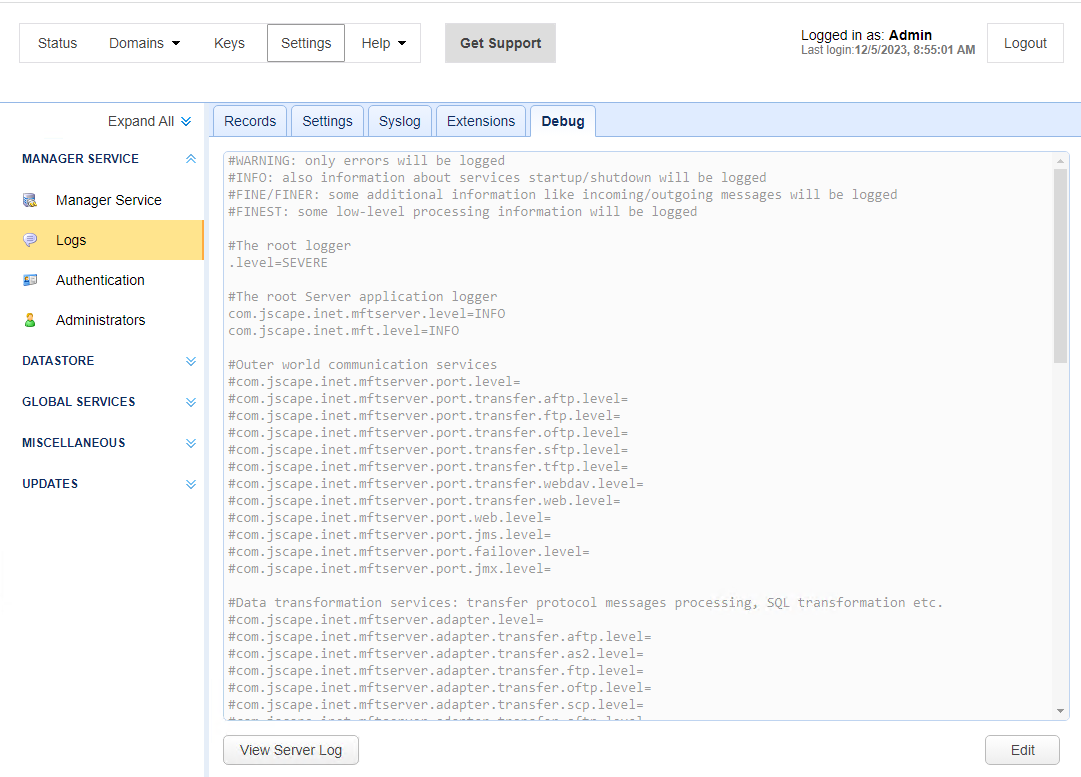
When you access this tab, the debug file (server-log.properties) displays in read-only mode as depicted in the image above. If you click Edit, you can modify the debug file. This file is located in the etc directory of your MFT Server installation. It is made accessible through the Debug tab, for your convenience. You can turn on the desired debugging options and set the appropriate debug levels. The debug data is written to the server0.log file. This file is located in your MFT Server installation's var/log directory. It is made accessible through the Debug tab, for your convenience. To view the log file, click on View Server Log.
The Debug tab is available to help JSCAPE technical support technicians and software developers troubleshoot customer issues without having to navigate through the file system to access the files used for this purpose. The MFT Server debugging option is implemented using Java Logging API's, contained in the java.util.logging package. If you are familiar with Java Logging API's, you can enable debugging on your own, if desired.